MATHS ACTIVITY - PAYING FOR THE WAR
You can find the answers to all these questions in the Paying for the War section of the The Economy display panels in the online exhibition John Curtin's Legacy: Leading Australia from war to peace.
Print out this page to record your answers. When you have completed the activity, you can check your answers using the online Answer Key.
A. War time expenditure 1941-1942
Collecting data
1. In the financial year 1941-1942:
a. How much money did the Curtin Government spend on the war effort? £ ________
Note: Until 1966, Australia used pounds, shillings and pence as its currency. The symbol for pounds is £ and £1 is the equivalent of $2. However during the war years, the average weekly wage for men was about £5 and for women about £3 and this was enough to live on. So £1 was worth a lot more in the war years than $2 is worth today!
b. How much of total government expenditure on the war effort came from the following sources of income?
-
taxes £ ______
-
loans and war savings certificates £ ______
-
Treasury Bills £ ______
-
other sources (eg temporary use of funds) £ ______
Interpreting Data
2. The diagram below shows the information that you have just collected presented as a circle (pie) graph.
a. Label the diagram to show which parts (sectors) represent money obtained from each of the following sources.
- taxes
- loans and war savings certificates
- Treasury Bills
- other sources
b. Circle the best answer. About one quarter of the government's income came from
- taxes
- loans and war savings certificates
- Treasury Bills
c. Circle the best answer. Approximately what fraction of the government's income came from taxes?
- one third
- two thirds
- three quarters
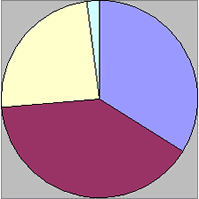
Sources of income for
Australian
Government
expenditure
on the war effort 1941-1942
B. War time expenditure 1942-1943
Collecting data
1. In the financial year 1942-1943
a. How much money did the Curtin Government spend on the war effort? £ ________
b. How much of total government expenditure on the war effort came from the following sources of income?
-
taxes £ ______
-
loans and war savings certificates £ ______
-
Treasury Bills £ ______
-
other sources (eg temporary use of funds) £ 11 million
Interpreting Data
2. The diagram below shows the information that you have just collected presented as a circle (pie) graph.
a. Label the diagram to show which parts (sectors) represent money obtained from each of the following sources.
- taxes
- loans and war savings certificates
- Treasury Bills
- other sources
3. a. Write down how much the government spent on the war effort for the financial year 1941-1942 and the financial year 1942-1943.
-
1941-1942 £ ________
-
1942-1943 £ _______
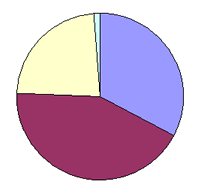
Sources of income for
Australian Government expenditure
on the war effort 1942-1943
b. Circle the correct answer. The total amount of money spent on the war effort
- increased between 1941-1942 and 1942-1943.
- decreased between 1941-1942 and 1942-1943.
c. How did the expenditure on the war effort in 1942-1943 compare to the expenditure in 1941-1942? (Circle the best answer.)
- the expenditure in 1942-1943 was more than twice as large as in 1941-1942.
- the expenditure in 1942-1943 was more than 3 times as large as in 1941-1942.
- the expenditure in 1942-1943 was more than 4 times as large as in 1941-1942.
- the expenditure in 1942-1943 was less than half the expenditure in 1941-1942.
- the expenditure in 1942-1943 was less than one third of the expenditure in 1941-1942.
- the expenditure in 1942-1943 was less than one quarter of the expenditure in 1941-1942.
d. Circle the best answer. The proportion of government expenditure on the war effort coming from taxes, loans and war savings certificates, Treasury Bills and 'other sources'
- changed significantly between 1941-1942 and 1942-1943.
- remained pretty much the same between 1941-1942 and 1942-1943.
Check how you went by comparing your answers with our Answer Key. l Online Activities Home Page