MATHS ACTIVITY - PAYING FOR THE WAR - ANSWER KEY
A. War time expenditure 1941-1942
1. In the financial year 1941-1942:
a. How much money did the Curtin Government spend on the war effort? £ 319 million
b. How much of total government expenditure on the war effort came from the following sources of income?
-
taxes £ 108 million
-
loans and war savings certificates £ 126 million
-
Treasury Bills £ 78 million
-
other sources (eg temporary use of funds) £ 6 million
Interpreting Data
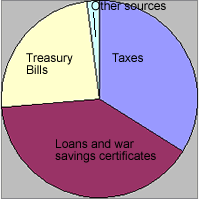
2. The diagram below shows the information that you have just collected presented as a circle (pie) graph.
a. Label the diagram to show which parts (sectors) represent money obtained from each of the following sources.
- taxes
- loans and war savings certificates
- Treasury Bills
- other sources
b. About one quarter of the government's income came from
- Treasury Bills
c. Approximately what fraction of the government's income came from taxes?
- one third

Sources of income for
Australian
Government
expenditure
on the war effort 1941-1942
B. War time expenditure 1942-1943
1. In the financial year 1942-1943
a. How much money did the Curtin Government spend on the war effort? £ 1,107 million
b. How much of total government expenditure on the war effort came from the following sources of income?
-
taxes £ 363 million
-
loans and war savings certificates £ 474 million
-
Treasury Bills £ 259 million
-
other sources (eg temporary use of funds) £ 11 million
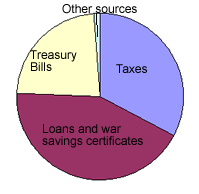
2. The diagram below shows the information that you have just collected presented as a circle (pie) graph.
a. Label the diagram to show which parts (sectors) represent money obtained from each of the following sources.
- taxes
- loans and war savings certificates
- Treasury Bills
- other sources
3. a. Write down how much the government spent on the war effort for the financial year 1941-1942 and the financial year 1942-1943.
-
1941-1942 £ 319 million
-
1942-1943 £ 1,107 million

Sources of income for
Australian Government expenditure
on the war effort 1942-1943
b. The total amount of money spent on the war effort
- increased between 1941-1942 and 1942-1943.
c. How many times larger was the expenditure on the war effort in 1942-1943 compared to the expenditure in 1941-1942?
- the expenditure in 1942-1943 was more than 3 times as large as in 1941-1942.
d. The proportion of government expenditure on the war effort coming from taxes, loans and war savings certificates, Treasury Bills and 'other sources' .
- remained pretty much the same between 1941-1942 and 1942-1943.
Back to Maths Activity - Paying for the War l Online Activities Home Page